Fracking Graphs
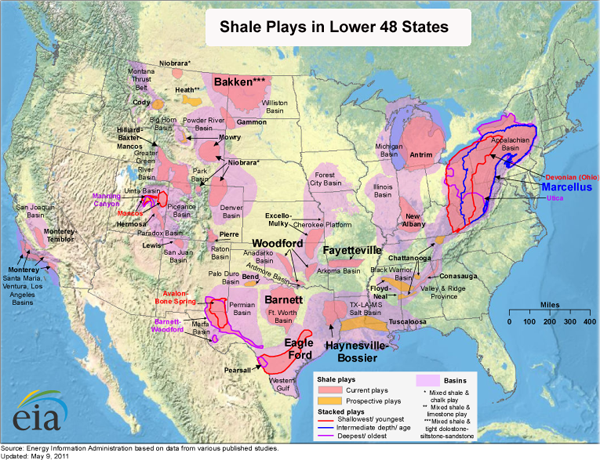
This is a graph that shows the existence of shale in the continental United States. Shale is where natural gas is found and drilled. This image is courtesy of US Department of Energy.
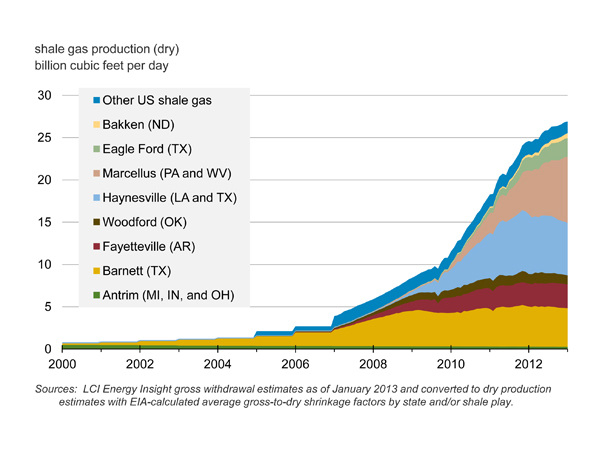
This next graph shows the current projections for the growth of shale gas in the energy market. This image is courtesy of the US Department of Energy.
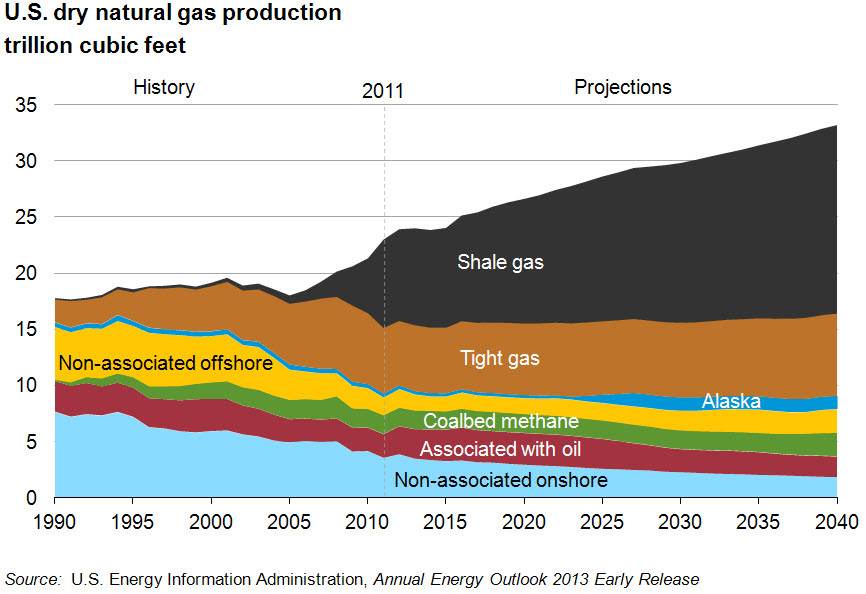
This final graph displays the amount of natural gas produced by location per year.